Managing and monitoring the performance of Internet of things (IoT) systems is a chore, albeit a necessary one in today’s life. With hundreds of thousands of things to monitor anomaly detection can aid in identifying where an error is occurring, improving root cause investigation and allowing for faster tech assistance. Anomaly detection aids in monitoring of engineering chaos caused by spotting outliers and alerting the appropriate parties to take action. Anomaly detection is a vital topic that has been addressed in a variety of fields and application domains. Many anomaly detection approaches are tailored to certain application areas, while others are more general. This article aims to give a comprehensive overview of anomaly detection research.
“An outlier is an observation which deviates so much from the other observations as to arouse suspicions that it was generated by a different mechanism.”, Writes Douglas Hawkins in his book “Identification of Outliers” [1], 1980. Outliers, novelties, noise, deviations, and exceptions are all terms used to describe anomalies. There are many possible origins of an outlier. It could be caused by an instrumental error occurring via faults in the equipment, a data collection blunder, or a random variation with unknown cause.
What is anomaly detection?
A procedure that detects the outliers/exceptions in a dataset, those items that don’t belong, is known as anomaly detection. In the context of wireless networks these anomalies might indicate unexpected network activity or a new pattern in data traffic, reveal a malfunctioning sensor or simply highlight data that should be cleaned before analysis.
Anomalies in data translate to valuable (and often crucial) actionable information in a wide range of application areas, making anomaly identification critical. Several research communities have produced a range of anomaly detection techniques over time. Many of these strategies were created with specific application domains, while others are more generalized.
Anomaly detection is used in a wider spectrum of applications. Anomaly detection is often used in business IT for the following purposes:
- Healthcare informatics / medical diagnostics
- Industrial damage detection
- Novel topic detection in text mining
- Image processing / video surveillance
- Insurance / credit card fraud detection
- Healthcare fraud detection
- Malfunction detection in safety-critical systems
- Military surveillance of enemy actions
- Event detection in sensor networks
- Ecosystem disturbances
- Data cleaning
Challenges of Anomaly Detection Process
There are several factors that make this process very challenging, which are:
- Normal behavior evolves in many fields, and a current definition of normal behavior may not be sufficiently representative in the future.
- The difficulty of defining a typical region that contains all conceivable normal behavior. Furthermore, the distinction between normal and anomalous behavior is frequently blurred. As a result, an anomalous observation near the boundary can be normal, and vice versa.
- When anomalies are caused by malicious behavior, malevolent adversaries frequently adapt to make the anomalous observations appear normal, thus identifying normal behavior more challenging.
- A key challenge is frequently the availability of labeled data for training/validation of models utilized by anomaly detection techniques.
- The data frequently contains noise that is difficult to recognize and eliminate since it is similar to the actual anomalies.
The anomaly detection problem, in its most general form, is difficult to solve due to the aforementioned challenges. In reality, most anomaly detection systems that are currently in use tackle a specific version of the issue. Various elements, such as the nature of the data, the availability of labeled data, the type of anomalies to be identified, and so on, influence the formulation. The application domain in which the anomalies must be detected often determines these characteristics. Researchers have used principles from a variety of fields to specific issue formulations, including statistics, machine learning, data mining, information theory, and spectral theory.
Types of Anomalies
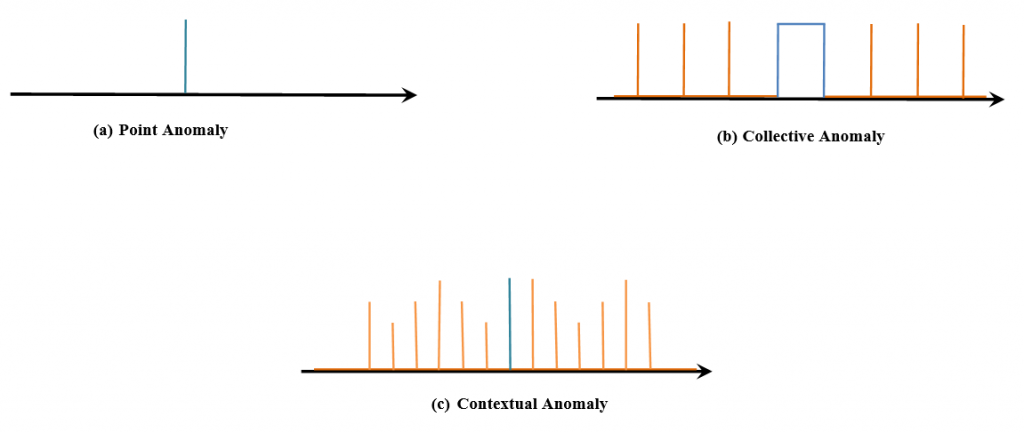
Anomalies can be broadly classified into three types: point anomalies, contextual anomalies, and collective anomalies. Deep anomaly detection (DAD) methods have been shown to detect all three types of anomalies with great success [2]. If a single observation deviates from all other observations in the dataset, it is categorized as a point anomaly. Collective anomalies occur when a subset of the dataset deviates in a consistent way, leading to the conclusion that the subset was formed by a different mechanism than the remainder of the dataset. A distinguishing aspect of collective anomalies is that just a subset of a group of observations is deemed anomalous, meaning that every observation in the subset is not always considered anomalous. A contextual anomaly occurs when an observation is categorized as an anomaly in one context but not in another. A contextual anomaly might be a single anomaly or a group of abnormalities [3]. Anomalies at the point, collective, and contextual layers are depicted in Figure 1.
Many distinct techniques are used based on the type of processing related to behavioral models. The following are some of the main techniques: Statistical based, Operational, or threshold metric model, Time series Model, Machine Learning based, Bayesian Model, Genetic Algorithm model, Neural Network Model, Fuzzy Logic Model, and Outlier Detection Model.
Anomaly detection using ML
Machine learning has become a tremendous technique in anomaly detection algorithms, ML suits the engineer’s purposes to create an anomaly detection system that Works better, adaptive, and on-time handles large datasets.
Popular ML Algorithms for unstructured data are:
- Self-organizing maps (SOM)
- K-means
- C-means
- Expectation-maximization meta-algorithm (EM)
- Adaptive resonance theory (ART)
- One-class support vector machine
The Popular ML Algorithms for Anomaly detection.
- Supervised
When a dataset is nicely prepared for the data scientist, with all data points classified as anomaly or nominal. This is the case where all anomalous points are known ahead of time. There are collections of data points that are anomalous, but they aren’t classified as such for the model to learn from.
- Unsupervised
The training data in unsupervised situations is unlabeled and consists of “nominal” and “anomaly” points.
The unsupervised scenario is the most difficult, as it is becoming increasingly difficult for modelers to cope with ever-increasing amounts of dark data. The sections of the datasets in the unsupervised scenario are not classified as nominal or anomalous. There is no basis for predicting what the outcome will be. The modeler must be able to tell what is abnormal and what is not.
“The most common tasks within unsupervised learning are clustering, representation learning, and density estimation. In all of these cases, we wish to learn the inherent structure of our data without using explicitly-provided labels.” [4]
To produce order in the unstructured data in the unsupervised setting a separate set of techniques is required. The basic purpose of unstructured data is to generate clusters from the data, then locate the few groupings that don’t belong. All anomaly detection techniques are, in essence, approximate density estimation algorithms.
Anomaly detection techniques in time series data
A time series can formally be described as Malhotra et al presents it in [6], as X ={x(1) , x(2), x(3),…, x(n) } where x(t)∈ R(m) , m = dimension and t = timestamp. x(t) is represented as an m-dimensional vector x(t)={x1, x2, …, xm}. In a time series where we only have one variable, m would be set to 1.
Popular anomaly detection techniques for time series data:
- STL decomposition
- Classification and Regression Trees (CART)
- Detection using Forecasting
- Clustering-based anomaly detection
- Autoencoders
Detection using Forecasting
Forecasting is used to find anomalies because it uses several points from the past to make a forecast of the future point with the inclusion of a random variable, generally white noise. As you can expect, anticipated future points will generate new points, and so on. It has a clear influence on the forecast horizon: the signal helps to smooth out. The most challenging component of adopting this strategy is deciding how many differences, autoregressions, and forecast error coefficients to use.
Time series forecasting is carried out using machine learning and statistical models, which are widespread technology. The pre-processed data is used in the models. Sequences of aggregated data scaled in the range [-1, 1] or [0, 1] are used as input to forecasting models. There is a significant amount of literature that covers various approaches of normalization. When normalization approaches are used in many machine learning setups the models perform better [7]. When using an unsupervised learning setup the training data used to fit the models is considered to be accurate, meaning that there are no anomalies. This is because the model is set up in such a way that all of the data it has seen throughout the training phase is assumed to be normal. The model, it is assumed, is used to view the data in the training set. However, when the model goes live or is exposed to testing data, any data with characteristics that differ from the training data will fail to be predicted by the model.
As a result, any unique points will have a bigger forecast inaccuracy than normal. That is why we want to build models capable of capturing periodic patterns in data and then failing miserably when incorrect data is introduced into the pipeline. The most commonly employed models in this scenario are multilayer perceptron, stacked LSTM, LSTM encoder-decoder, and linear autoregressive. With the exception of the LSTM enc-dec, which aims to reproduce the input itself after compressing the data with the encoder and then unzipping it with the decoder, they all work on the same premise of utilizing previous sequential data to try and predict future data.
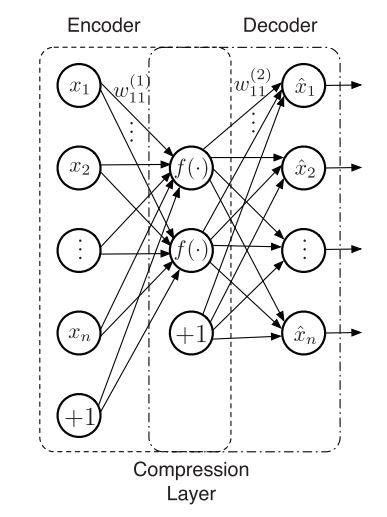
Autoencoder consists of an Encoder and a Decoder as shown in Figure 2.
- Encoder network: Accepts high-dimensional input data and translates it to latent low-dimensional data. The input size to an Encoder network is larger than its output size.
- Decoder network: The Decoder network receives the input from the Encoder coder’s output. Decoder’s objective is to reconstruct the input data. The output size of a Decoder network is larger than its input size.
Anomaly detection using Autoencoders
Follow the following steps to detect anomalies in a high-dimension dataset. You can apply this to unbalanced datasets too.
- During the training, input only normal transactions to the Encoder. The bottleneck layer will learn the latent representation of the normal input data.
- The Decoder will use the bottleneck layers output to reconstruct the normal transactions of the original input data.
- A fraudulent transaction will be different from a normal transaction. The Autoencoder will have trouble reconstructing the fraudulent transaction, and hence the reconstruction error will be high.
- You can flag a new transaction as fraudulent based on a specified threshold value for the reconstruction error.
References
[1] D. Hawkins. Identification of Outliers. Springer Netherlands, 1980.
[2] Charu C. Aggarwal. Outlier Analysis. Springer International Publishing, 2017.
[3] S. Kim, “Detecting contextual network anomaly in the radio network controller from bayesian data analysis”, Master’s thesis, KTH Royal Institute of Technology, 2015.
[4] Siddiqui, Amran & Fern, Alan & Dietterich, Thomas & Wong, Weng-Keen. (2015). Sequential Feature Explanations for Anomaly Detection. ACM Transactions on Knowledge Discovery from Data. 13. 10.1145/3230666.
[5] Devin Soni, “Understanding the differences between the two main types of machine learning methods”
[6] P. Malhotra, L. Vig, G. Shroff, and P. Agarwal, “Long short term memory networks for anomaly detection in time series”, in Proc. 23rd European Symposium On Artificial Neural Networks Computational Intelligence and Machine Learning, 2015, p. 89.
[7] Samit Bhanja and Abhishek Das. Impact of data normalization on deep neural network for time series forecasting. CoRR, abs/1812.05519, 2018.